
But What is a Distribution?
Published:
Throughout the past blogs of the “how good is my model” series, I have been talking solely in distributions. I think of the model performance as a distribution, and I build all my intuition with a distribution in mind. But what do I have in mind exactly when I think in distributions? And why does it matter? And why do I end up talking about beliefs?? And why does my model care about beliefs???
In this post, I want to take a detour to walk myself, and you, around foundational concepts of distributions. I want to talk about it because it is going to keep popping up in most of the coming posts, and it would be very helpful to see why one needs to pay deep attention to it.
This is highly emphasized since I am mainly talking about machine learning so far… and machines, after all, learn from distributions.
Distributions make beliefs
If you have not picked up on it yet, I am an elemental person. Whenever there is a concept that I need to understand, my first thought is to strip it down to its most basic and elemental aspects, then construct it bottom up.
So, when I want to talk about distributions, I want to go elemental…
The example I have in mind is a distribution of a single outcome (apparently called a degenerate distribution).
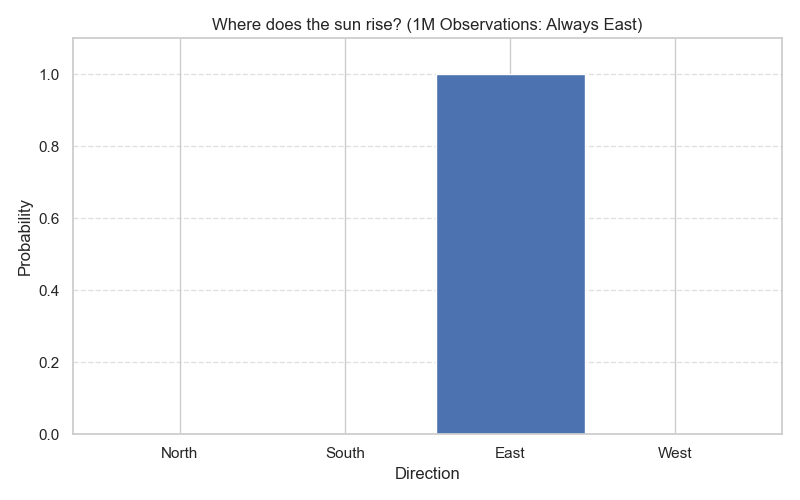
If I ask the following question: Where does the sun rise?
I will know that there are four different directions: north, south, east, and west.
But I also know that for the last infinite days, the sun has only been rising from the east (Figure 1).
So, a distribution is a mere concept of two things:
- Possible outcomes
- The count of each outcome over a certain number of observations
And it is the count of these outcomes that helps us shape our view of the world.
The sun rises from the east has become a fact because it keeps happening over and over without failing once to rise from any other direction.
This distribution has helped us to construct this fact… the sun rises from the east.
If I ask another question like: How many times will I get heads vs. tails when I toss a coin?
I toss it 100K times, and it turns out to be a 50:50 distribution (Figure 2).
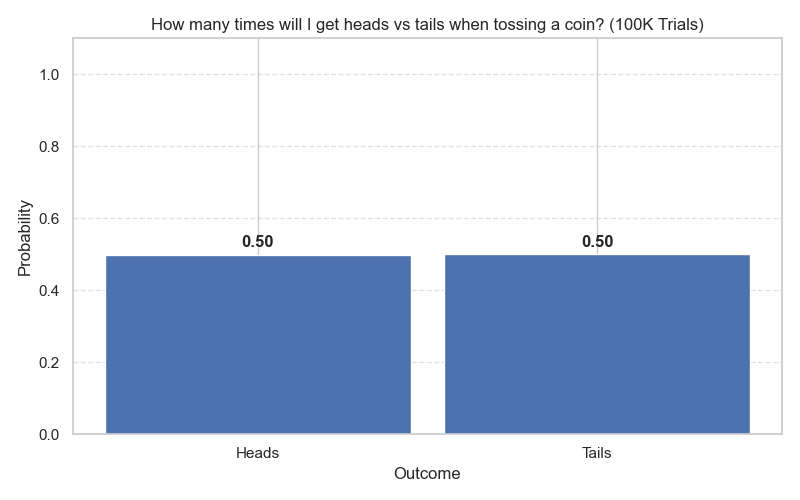
And this makes me form the belief that there is no force to make either of the options more probable than the other.
The outcome is random because my distribution is uniform.
But beliefs can be challenged!
Now, these beliefs I have about the sun and the coin would have been there before I even bothered to plot a distribution.
If anyone asked me where the sun rises, or what is the probability of getting heads vs. tails for a fair coin, my answer would have been pre-packaged.
I would not need to go perform an experiment and build a distribution to answer.
But what if someone showed me these two distributions in Figure 3 for where the sun rises and the heads vs. tails of a coin toss?
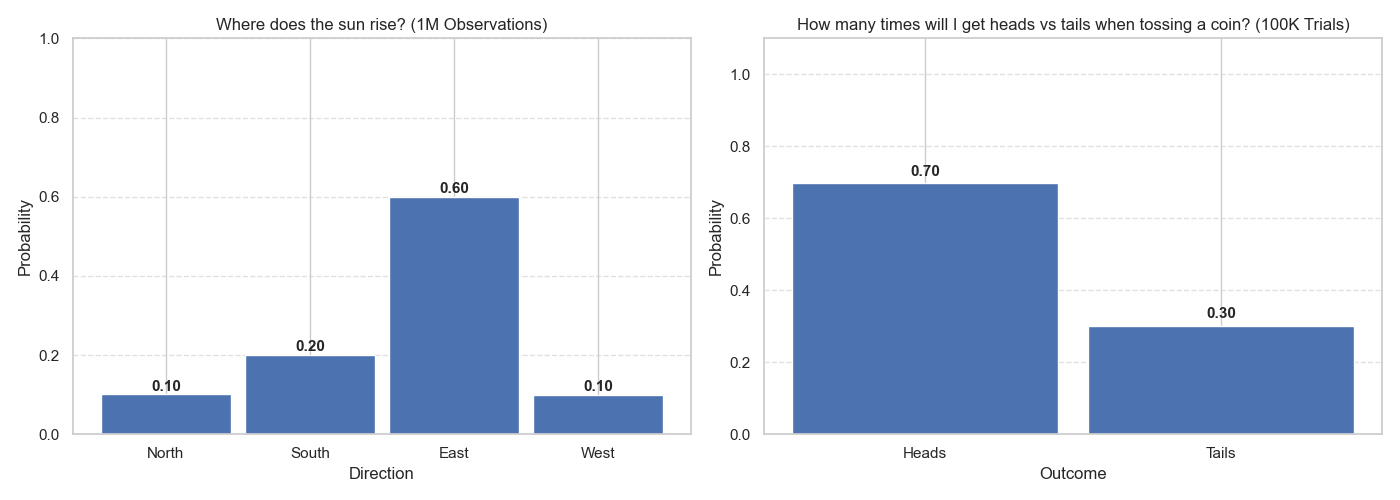
Now, these distributions will go completely against my beliefs! And I would either need to reject them solemnly, or find an explanation for why they might look like this.
If I had to make a guess, I would say the sun observations were made from a different universe than ours, and that the coin was not fair (i.e., it was manipulated to be heavier on one side).
So, whenever we have a question in mind, it is either a question that we have a prior belief about how it can be answered, or it comes with a blank slate, and we are ready to see what the answer might look like.
- If I have a belief (i.e., prior) and new observations support it, then my belief still holds.
- If I have a belief and new observations counter it, I either
2.1. Challenge my belief (e.g., if it was not built on enough observations).
2.2. Stick to my belief (e.g., because it is based on solid long observations) and try to figure out why there could be counter-observations (e.g., is it a different distribution?). - If I do not have a prior belief (i.e., the question is new to me), then:
3.1. I collect observations.
3.2. I form a belief based on the current observations.
3.3. I do the process displayed in 1 and 2 of when I have a prior belief.
The game of changing beliefs!
So, to make the concepts of distributions and its relatedness to beliefs more crisp, let us look at this example.
If I asked you to stop people in the street and ask them to pick a number randomly between 1 and 100, would you have any reason to assume that some numbers appear more than others?
I will assume that you answered no, and then we are making a belief that the distribution of this experiment will be uniform (i.e., all outcomes are equally probable).
Now, this YT video from Veritasium ran this experiment on 200K people on the internet, and they got this distribution in Figure 4.
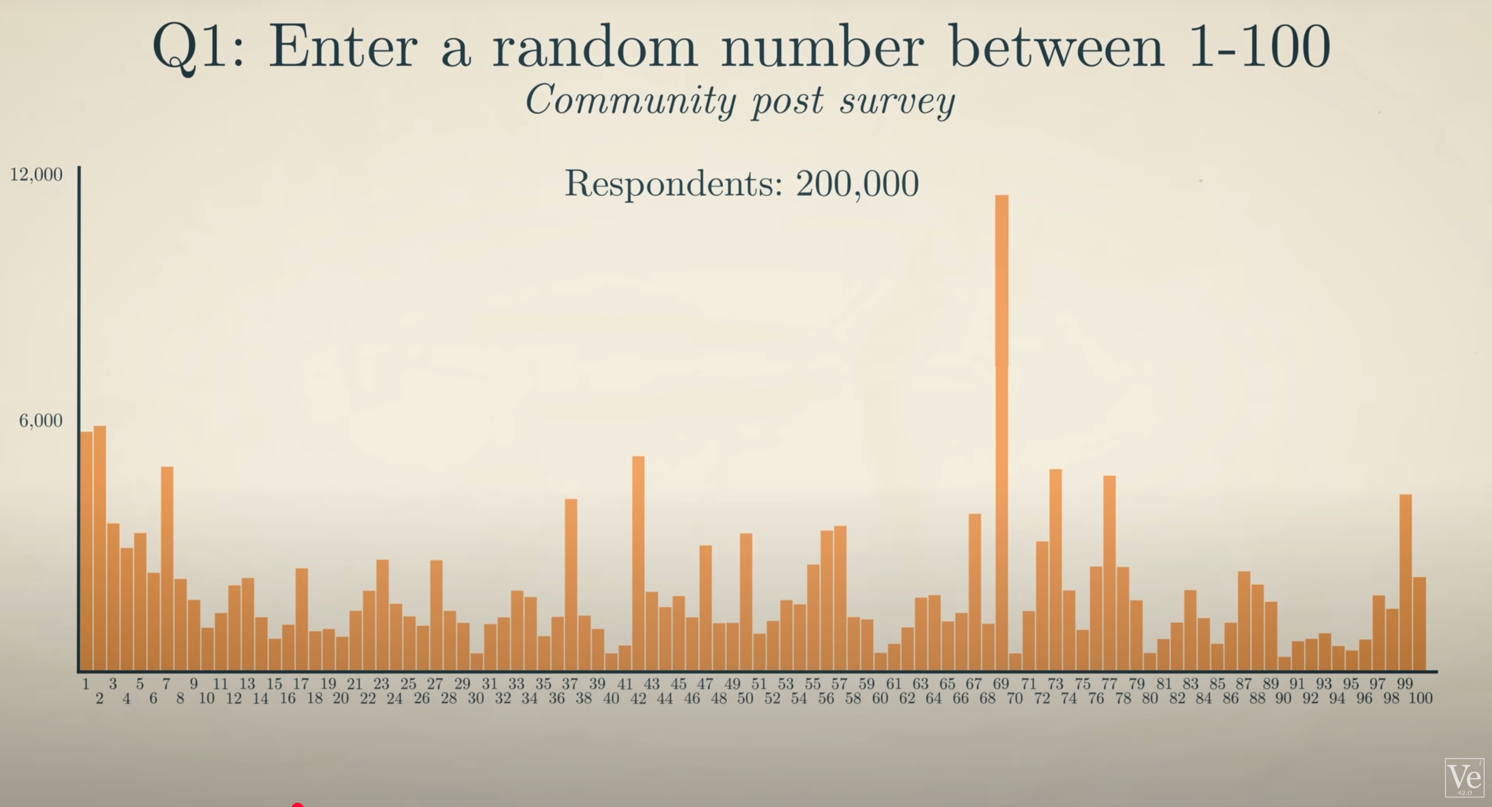
And this distribution is telling us that it is not random at all!
Of course, choosing a number for a specific individual is not a random choice. People have favourite numbers or numbers associated with special events.
However, on a global level, I would assume that each individual’s personal preferences would be blurred in the masses, and a certain number would not have a reason to appear more frequently than the next one.
But humans are immersed in collective assumptions 1.
And these assumptions break our reason of independence.
For example, the numbers 1, 2, 99, and 100 were already triggering people to choose them because they were boundary numbers. 50 was also a triggering number because it is the one right in the middle2. The extremes and the middle are usually a comfort zone for people to choose.
The number 42 is a nerdy joke from the Hitchhiker’s Guide to the Galaxy comedy show3. While the number 69 is famous for other reasons…
So, these numbers are already expected to show up more than others because of their psychological, historical, and playful backgrounds.
Now, other than looking at what is more likely to occur, one can look at what is less likely to occur.
And this is another psychological trick from the question.
When you ask someone to pick a “random” number, apparently it translates into picking a “non-traditional” number.
And apparently, even numbers and multiples of 5 and 10 are common numbers in our world. Because people are more exposed to them, they do not feel random.
Hence, they appear with the lowest frequencies in the distribution.
The numbers found to be more likely after removing the triggering numbers were 37 and 73, and any number containing 3 and 7!
In the YT video, there is a hypothesis for why these are the most likely numbers to be selected, and this hypothesis includes prime numbers.
So, what happened in this example is that I had a belief about what the answer to a certain question would look like.
An empirical distribution challenged my belief.
And explanations from psychology, sociology, and mathematics helped me understand this discrepancy between the belief and the state of the world.
The end result: Acquired new knowledge and an update in my belief about the answer to this question.
How to make beliefs and facts?
Now, back to the sun example. The only reason it is considered a fact is that life has been on earth for as far as you can count, and we have all seen (and been taught) over and over that it rises from the east.
But if you were the first life form on earth, on the first day, and you were asked where the sun rises from, you would have no clue.
On the second day you could say: Oh, today I saw it rising from this direction.
On the 10th day you could say: For the past 10 days it has been rising from this direction.
On your deathbed you could say: I have never seen the sun rise from any direction but east.
After many years, and after your offspring have kept carrying the knowledge and expanding it, one of your great-grandkids could say: I have no doubt that the sun rises from the east.
The way to make a belief is to collect observations, and the way to make facts is to collect enough observations.
Let us check the gif in Figure 5 of tossing a coin. Even though I know that it will be a 50:50 uniform distribution, this does not show immediately.
Figure 5: It takes large numbers of observations to land on the true distribution.
Up until the first 50 tosses, the distribution is not uniform at all. And even when the distribution gets very close to uniform after 500 tosses, it is still not 50:50 yet.
If I stop my observations after 10 or 100, I will form a premature belief about the real distribution.
So, to make a belief, and eventually land on a fact, one needs to be patient, willing to update their prior, and wait until the final shape of a distribution emerges.
Anything before this should be up to challenge and scrutiny!
How to support a belief?
Distributions tell me the state of the world in the eyes of the question I am asking (Figure 6).
Understanding the factors that made a distribution look the way it looks is a different matter…
When I ask people to select a random number between 1 and 100, I believe it would lead to a uniform (random) distribution.
I justified my belief by the assumption that numbers do not have intrinsic values that make one special and the other not.
The empirical distribution (Figure 4) made people stop and ponder. And it made them look in different directions to justify why the world of this question looked the way it looked.
At the beginning of the pondering, no one knew how to justify it.
But with the persistence of making assumptions and filtering or validating them, we found mini answers in psychology, sociology, and math.
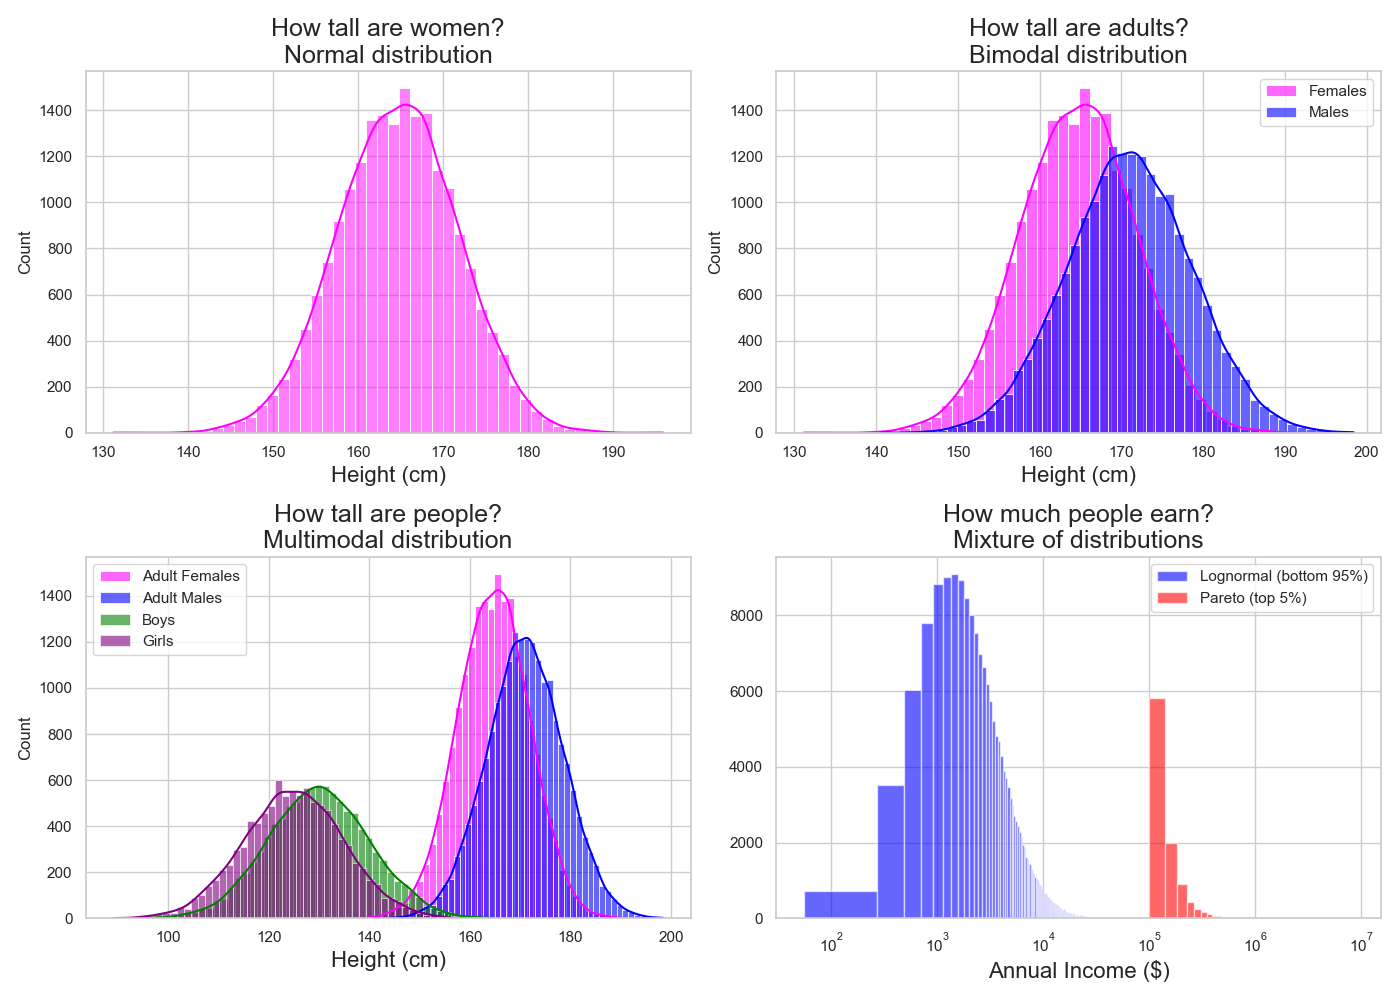
Let us say I ask this question next: How tall are women?
Figure 6 above (top left) shows me that the average height for adult females is 165 cm. I see that most observations cluster around this middle value, and observations get fewer the farther we move away from it on either side.
So, when I see the state of adult female heights like this, I can say that this is the state of the world and move on.
Or, I can ask: why? Why is the state of the world like this?
Again, at the beginning, no one knew why. But some people—who got intrigued by the “why” question—kept looking until something got them hooked.
Based on years of asking and people pondering, we reached some plausible answers in the fields of genetics, geography, nutrition, economics, etc.
There is something in each of these fields that is contributing a little bit to the reason why the world of heights looks the way it looks.
How do these fields answer the why question?
The answer is again in distributions. There are distributions in these fields that were found to correlate with the distribution under study.
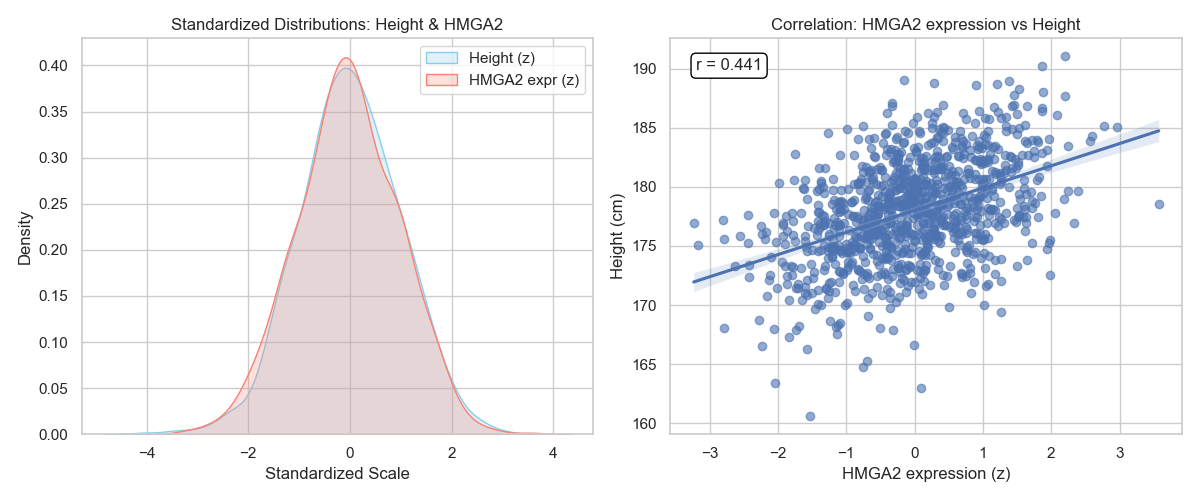
For example, in genetics, some genes are expressed differently between individuals. The distribution of these expressions would look similar to the distribution of a population heights (e.g., the more a gene is expressed, the taller a person is, or vice versa) (Figure 7).
In geography, the earth has different altitudes. The distribution of altitudes correlates with the height distribution under study (e.g., the higher the altitude, the shorter the population).
In economics, the income distribution correlates with height. The better the living conditions, the more likely it is for a person to reach a specific height.
And so on and so on.
One asks a question, one observes the distribution of the world for this question, one checks for other distributions that match this one, and decides whether they fit to justify this initial distribution or not.
Bonus insight: When a certain outcome is the product of many small interacting factors, the final distribution shape ends up being normal (remember CLT from the last posts!)
How to turn a belief into a fact?
Now, to say that something correlates with another thing does not mean that the former causes the latter.
Correlation vs causation
If a gene correlates with height, this is all there is to infer for as far as we know.
The two distributions look similar.
To say that gene X influences height, one needs to put this assumption under testing.
How?
This will be a bit morbid because it includes trials on living organisms, but one way to do so is to knock out this gene in a newborn organism and see how the individual turns out.
Repeat this many times and check whether each time the organism indeed grows to be short (i.e., build your own distribution).
Compare this to other organisms where you do not knock out this gene, and see if they maintain their heights (Figure 8).
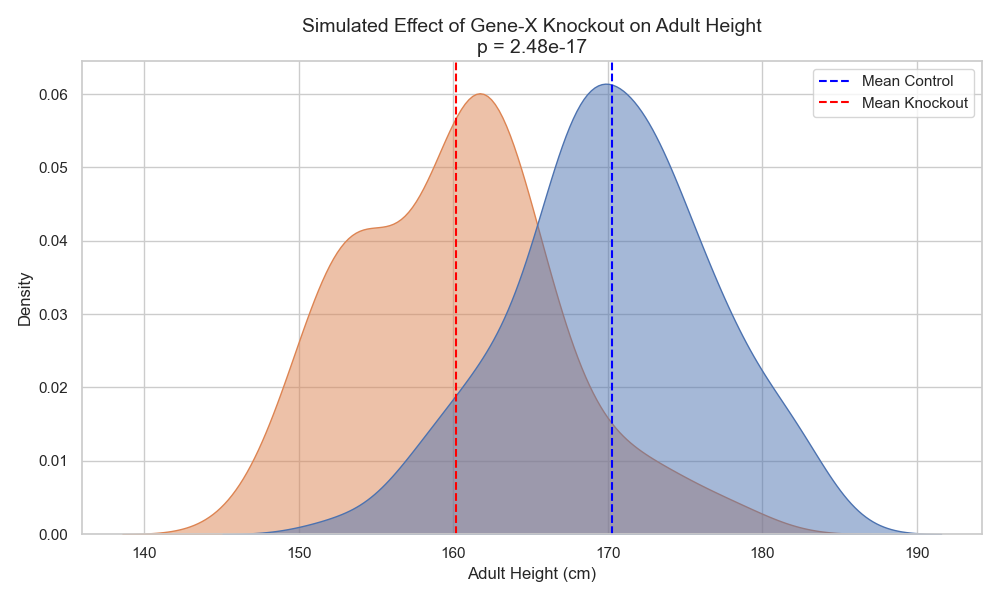
Only after a series of long and rigorous experimentation with consistent outcomes can one say that the correlation was indeed causation.
Before this, correlation is just correlation.
Can you believe it?
One can find a logical explanation that others can regard highly.
For example, one can explain that people in wealthy conditions receive good nutrition, and this leads to healthy development.
Therefore, people in wealthy conditions tend to be taller than their underprivileged peers.
This is a hypothesis.
Proving it by the causality line is a bit hard. Again, it involves a morbid experiment of putting living organisms under intentional stress and starvation and comparing them to others who were put in lavish conditions to see how each turns out.
But I believe many people would find the hypothesis compelling without doing the experiment.
And when people find something compelling, they tend to believe it as well.
And that is also one way to justify a belief outside of causation.
To make others believe in it with me!
How is all this relevant to my model?
The post is getting too long now, and a proper answer for this question will need to be detailed in another post.
But as a teaser, a machine learning model is all about distributions.
When I train my model to answer a question like: How soluble is my molecule? I am feeding it loads of distributions to learn from (Figure 9).
The distribution of the training dataset is my claim to the model that this is the state of the world it needs to understand.
The features I use to describe my molecule, like molecular weight or polarity, are the fields I am asking my model to find relationships from that match the state of the world I am showing it.
And the mathematical equations embedded in the model itself to extract these correlations are themselves based on assumed behavior of the world.
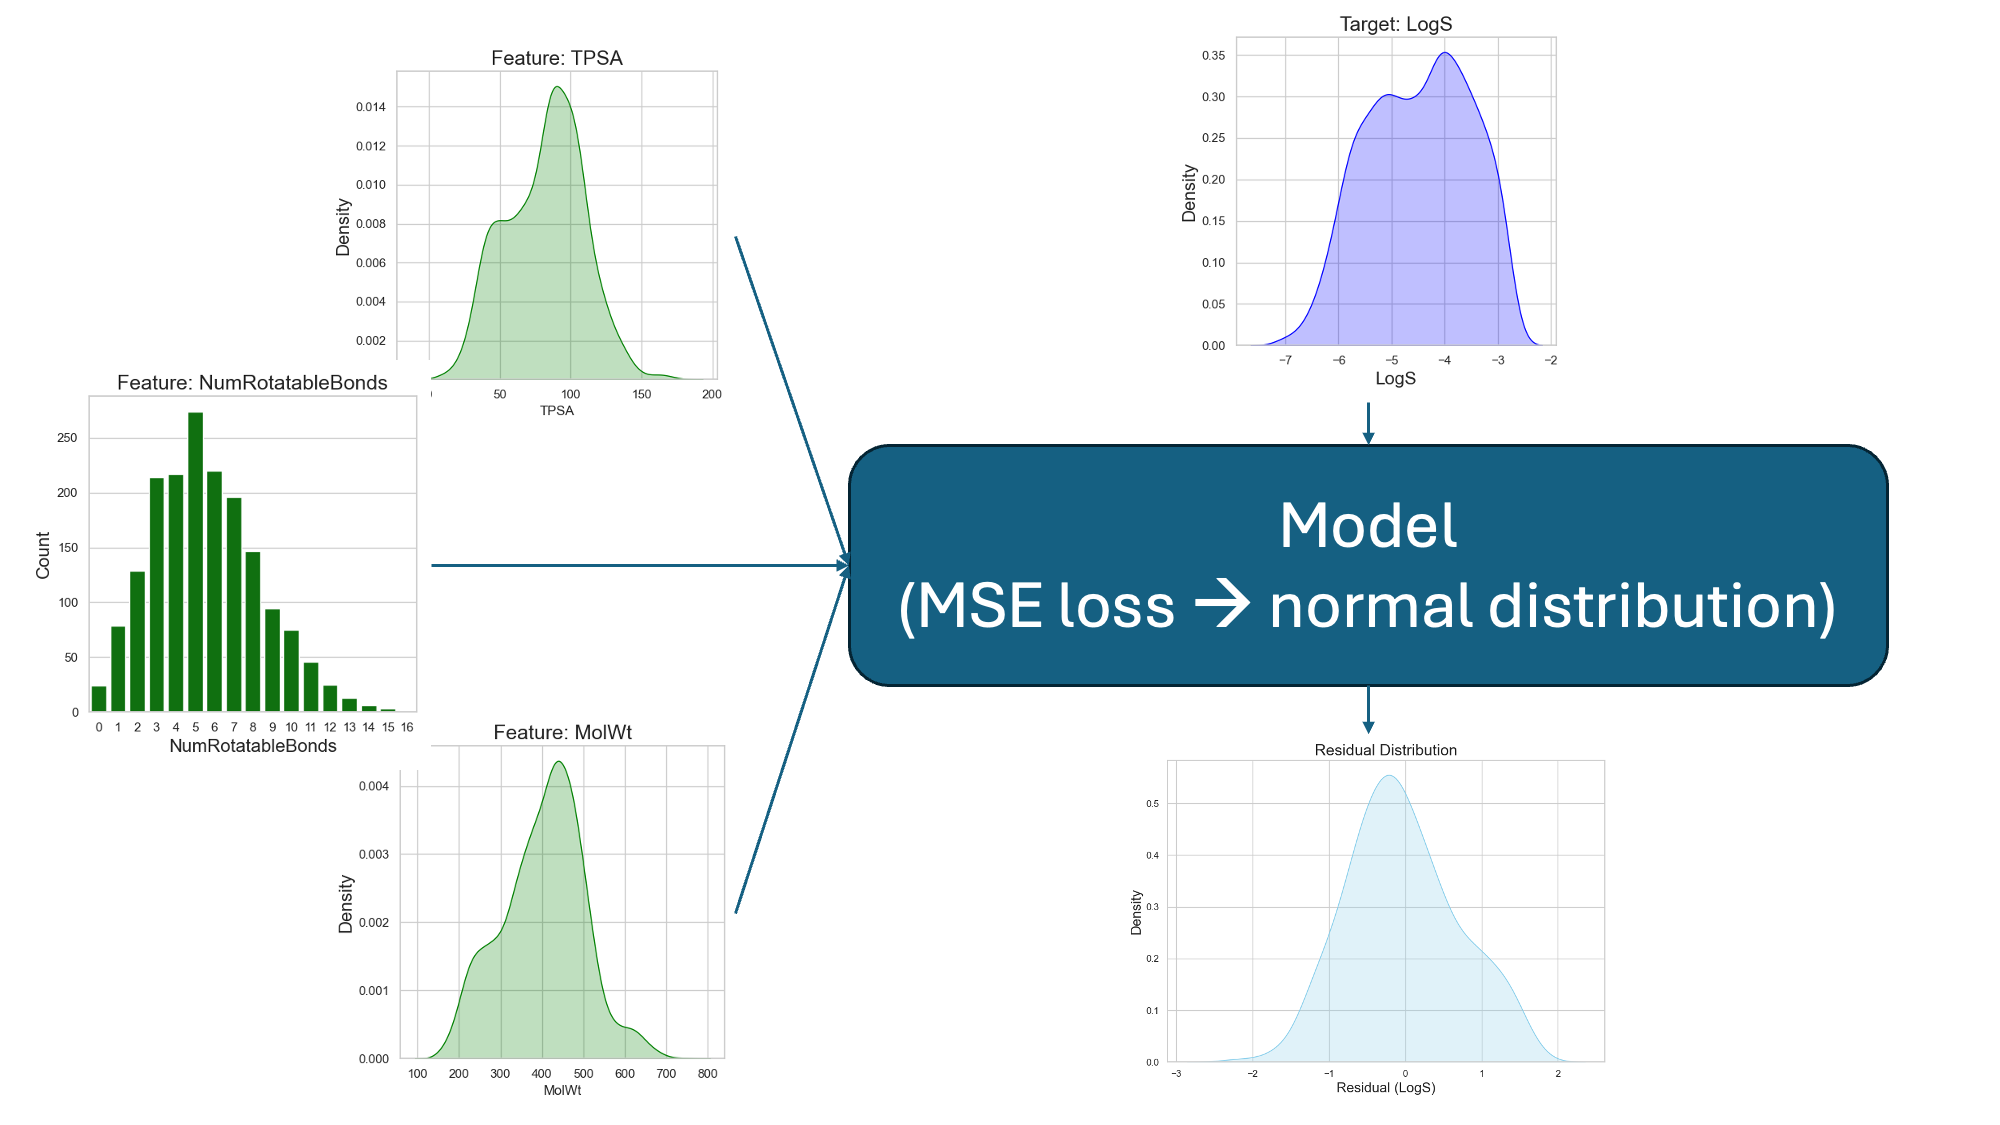
So, even though we do not explicitly talk in distributions when we train and test our models, every single step in a machine learning pipeline is heavily immersed in distributions.
And as I showed all along the post… distributions make beliefs!
And so, what my model learns and ends up producing is actually… just beliefs!
Because our traditional ML models do not run experiments to confirm causality.
They merely spot (cor)relations.
(Cor)relations that can be found out to be justified later on…
Or they can be found to be just quirks of something we fed the model.
But at the end of the day, and without us—the humans—running the experiments to justify these correlations, they remain beliefs.
A great collection from Big Think on Collective Illusions ↩
Most of the explanation of the number frequencies is discussed in the YT video. ↩
It makes sense that many people who watch Veritasium and participated in the poll would be acquainted with this show… and this number! ↩